Key takeaways
- An EPD is a third-party verified disclosure under ISO 14025, not an environmental superiority rating.
- Never compare a per-kilogram declared unit against a per-square-meter declared unit without normalizing to an installed functional assembly.
- Cradle-to-gate (A1–A3) declarations omit jobsite freight, mortars, adhesives, carrier rails (A4–A5), and replacement cycles over the building study period (B1–B7).
- Global Warming Potential (GWP) is only one indicator; check acidification, eutrophication, smog, water use, primary energy, and separate indoor VOC certificates.
Treating two headline carbon numbers from different datasheets as a direct ranking leads to wrong material choices, rejected submittals, and wasted specification rework. To compare building materials in the context of environmental impact, verify that both products fulfill the same installed function and that their Environmental Product Declarations (EPDs) share the same Product Category Rule (PCR), reference unit, life-cycle modules (A1–A3 vs. A1–C4), data specificity, and validity window before comparing any impact indicator.
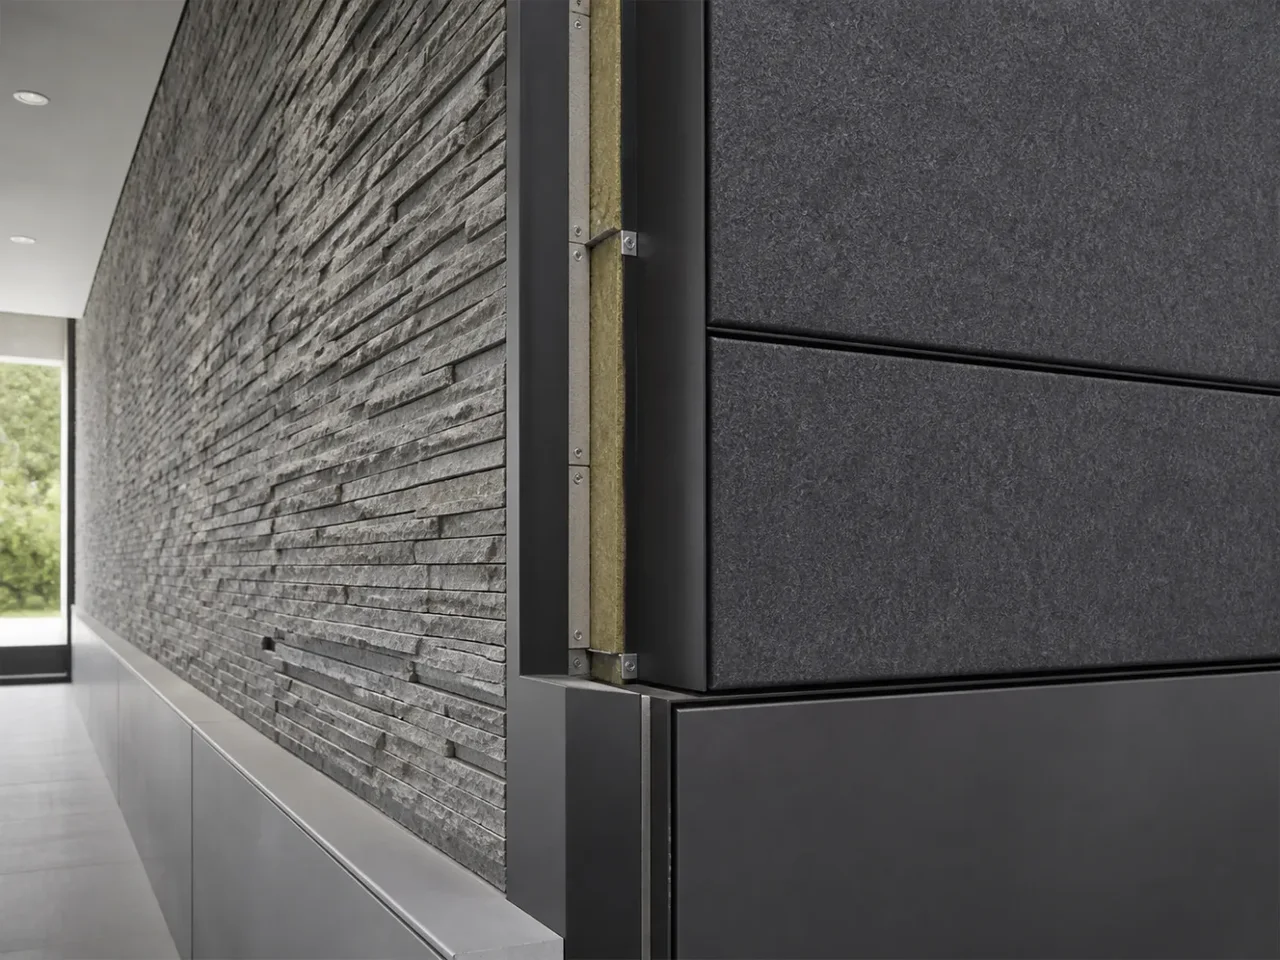
For interior and exterior finishes—such as porcelain slabs, fiber-cement cladding, metal wall panels, natural stone veneer, or WPC wall panels—a raw product declaration rarely tells the full story on its own. One manufacturer’s declaration often reports impacts per kilogram of factory output through the factory gate (A1–A3), while another reports per square meter of installed surface including ancillary adhesives, carrier rails, maintenance cycles, and disposal (A1–C4). This guide and its printable pre-comparison EPD boundary check sheet (CSV record) set out the verification steps required before placing two finish materials side by side.
Quick Specs: Pre-Comparison EPD Boundary Matrix
Before reading Global Warming Potential (GWP) or resource figures on two declarations, check the seven boundary fields below. Under ISO 14025 and ISO 21930 (and the U.S. Environmental Protection Agency’s EPD Basics, EPA 744-F-24-002), a mismatch in any of the first four rows invalidates a direct datasheet-to-datasheet comparison.
Scroll horizontally to view all columns.
| Boundary field on the EPD | What to verify on both declarations | Why a mismatch invalidates direct comparison | Action when declarations do not align |
|---|---|---|---|
| 1. Installed function | Both products serve the same building location, exposure class, structural or acoustic role, and target design life. | An EPD only supports comparisons between products fulfilling the same function (U.S. EPA, 2024). | Define the complete wall or floor assembly first (see how to choose building materials). |
| 2. Product Category Rule (PCR) | Identical category PCR title, version, and core standard (ISO 21930 or EN 15804). | Different PCRs assign different allocation rules, cutoff thresholds, and module assumptions. | Do not rank raw numbers across different PCRs; use a whole-building LCA (WBLCA) model for cross-category assemblies. |
| 3. Reference unit (Declared vs. Functional) | Same unit of measure (1 m², 100 m², 1,000 ft², 1 kg, or 1 m³) and stated mass per unit area (kg/m²). |
Comparing 1 kg of steel or glass against 1 m² of flooring or siding ignores installed thickness and panel weight. | Convert mass-based figures using the product’s declared density and thickness per 1 m² of finished surface. |
| 4. System boundary modules | Identical life-cycle stages included: cradle-to-gate (A1–A3) vs. cradle-to-grave (A1–C4). |
Comparing an A1–A3 declaration against an A1–C4 declaration penalizes the product that disclosed installation, use, and disposal. |
Restrict initial product-stage screening to A1–A3, then account for A4–C4 assembly differences separately. |
5. Ancillary installation scope (A4–A5) |
Inclusion of thinset mortar, adhesives, vapor retarders, underlayments, aluminum carrier rails, clips, and cutting waste. | Two 1 m² finish panels with similar factory impacts can require vastly different sub-framing or setting beds on site. | Add the installation layers required by each system’s installation datasheet before comparing assemblies. |
6. Reference Service Life (RSL, B1–B7) |
Stated service life, recoating or seal-maintenance schedule (B2), and replacement frequency (B4) over the building study period. |
A finish replaced three times over a 60-year building life triples its production, transport, and demolition impacts. | Scale product-stage and end-of-life impacts by the number of replacement cycles over the project’s design life. |
| 7. Data specificity & validity | Facility-specific vs. manufacturer-average vs. industry-average data; 12-month foreground data period; within 5-year validity window. | Comparing an expired industry-average baseline against a modern single-plant renewable-powered line distorts procurement decisions. | Request a current facility-specific EPD for the actual plant supplying the project region. |
Key Takeaway: Never subtract or rank impact figures from two Environmental Product Declarations until you confirm that both cover the same functional assembly, PCR version, reference unit, and life-cycle stage modules.
1. What an Environmental Product Declaration (EPD) Proves—and What It Does Not
An Environmental Product Declaration (EPD) is a third-party verified Type III environmental declaration prepared in accordance with ISO 14025. As defined in the U.S. EPA’s EPD Basics: Why and How to Develop an Environmental Product Declaration (EPA 744-F-24-002, November 2024), an EPD transparently communicates the quantified environmental performance of a product or material based on an underlying Life Cycle Assessment (LCA) conducted under ISO 14040 and ISO 14044 and governed by Product Category Rules (PCRs).
Because an EPD reports verified accounting rather than a performance grade, three structural limits apply to every declaration:
- An EPD is a disclosure document, not an environmental superiority seal. Possessing a registered EPD proves that the manufacturer measured and third-party verified its life-cycle inventory against a stated PCR. It does not mean the product has low emissions, low water use, or zero hazardous ingredients.
- Comparability is strictly bounded by function and rules. Both ISO 14025 and the U.S. EPA state that the purpose of an EPD is to enable standardized comparisons between products that fulfill the same function. When two products follow different PCRs, use different background databases, or omit different life-cycle stages, their headline numbers are mathematically non-comparable.
- Product Stage (
A1–A3) is not Building Assembly Performance. As the Carbon Leadership Forum’s 2021 Material Baseline Report (Version 2, July 2021—used here strictly as a historical methodology reference) explained, most construction product EPDs cover only the factory gate (A1–A3). They cannot be used by themselves to compare across different material categories or to compare finishes that require different structural backups, attachment hardware, maintenance regimes, or end-of-life processing.
2. Step 1: Check Functional Equivalence vs. Declared Units
The single most common error when specifiers compare building materials in the context of environmental impact is confusing a declared unit with a functional unit.
In life-cycle accounting (U.S. EPA, 2024; ISO 21930):
- A functional unit defines the quantified performance of a product system for use as a reference unit—assuring that the products being compared provide an equivalent level of function or service over a stated period (for example, 1 m² of interior floor covering meeting a specified commercial wear rating for 30 years, including adhesive and maintenance).
- A declared unit is a physical quantity of a construction material—such as 1 metric ton, 1 kg, 1 m², or 1 m³—used when an EPD covers only partial information modules (such as
A1–A3) or when a material can be used in multiple building applications whose exact in-service function is not fixed at the factory gate.
How Historical PCR Reference Units Differ Across Material Categories
In North American and international PCR practice (documented in the historical 2021 CLF methodology report and ISO 21930 category rules), different material families declare impacts against different physical units:
Scroll horizontally to view all columns.
| Material category | Typical PCR reference unit | Why raw per-unit numbers cannot be compared directly across categories |
|---|---|---|
| Resilient flooring, carpet, acoustic ceilings | 1 m² |
Reports per unit of surface coverage, but installed service life (RSL), subfloor leveling compound, and adhesive coverage vary by product type. |
| Gypsum board | 1,000 ft² (92.9 m²) or 1 m² |
Area unit depends on board thickness (1/2 in. vs. 5/8 in. Type X) and core formulation. |
| Metal wall panels | 100 m² or 1 m² |
Panel skin gauge, profile depth (corrugated vs. cassette), and secondary girts or clips change the actual mass of metal per square meter of wall. |
| Cold-formed steel studs, structural steel, flat glass | 1 metric ton (1,000 kg) or 1 kg |
Mass-based declared unit; comparing 1 kg of steel or glass against 1 m² of cladding is meaningless without knowing kilograms per square meter of installed wall. |
| Dimension lumber, engineered wood, concrete | 1 m³ or 1 yd³ |
Volume-based declared unit; must be multiplied by member cross-section or slab thickness per square meter of floor or wall area. |
| Thermal insulation | 1 m²-Rsi (1 m² at R_SI = 1 m²·K/W) |
Normalizes area by thermal resistance, because thickness required to reach code R-value varies by material conductivity. |
Even when two finish products both report per 1 m²—for instance, comparing porcelain slabs against natural stone veneer or WPC wall panels—a declared unit of 1 m² at the factory gate still omits thickness differences, substrate backing requirements, and attachment hardware. Always check the mass per declared unit (kg/m²) and the required assembly layers on the technical datasheet before normalizing two declarations.
3. Step 2: Align System Boundaries Across Life-Cycle Modules (A1–C4)
Under ISO 21930 and EN 15804, a construction product’s life cycle is divided into standardized information modules (A1 through C4, plus optional module D for reuse, recovery, or recycling potentials beyond the system boundary). As the U.S. EPA’s EPD Basics (2024) notes, construction EPDs fall into two primary boundary scopes:
- Cradle-to-gate EPD (
A1–A3): Covers only the Product Stage—raw material extraction and upstream processing (A1), transport of raw materials to the factory (A2), and manufacturing (A3). - Cradle-to-grave EPD (
A1–C4): Covers the full life cycle by adding the Construction Stage (A4–A5), Use Stage (B1–B7), and End-of-Life Stage (C1–C4).
Scroll horizontally to view all columns.
| Life-cycle stage | Modules | What occurs in this stage for wall and floor finishes | When omitting this stage distorts a material comparison |
|---|---|---|---|
| Product Stage | A1 Raw material supply; A2 Transport to factory; A3 Manufacturing |
Quarrying, mining, resin synthesis, kiln firing, extrusion, coil coating, factory energy grid mix, and plant scrap. | Always included, but plant electricity grid mix and fuel source cause large differences between facilities making the same product. |
| Construction Stage | A4 Transport to jobsite; A5 Installation into building |
Long-distance freight (A4), site equipment, cutting waste, packaging disposal, and ancillary installation materials (A5). |
Heavy stone or tile trucked long distances (A4) vs. lightweight sheets; dry-hung panels on aluminum rails vs. wet polymer-modified mortar beds (A5). |
| Use Stage | B1 Use; B2 Maintenance; B3 Repair; B4 Replacement; B5 Refurbishment; B6 Operational energy; B7 Operational water |
Cleaning chemicals and water (B2), periodic sealers or coatings (B2/B3), full finish replacement cycles (B4), and surface emissions or blowing-agent off-gassing (B1). |
Comparing a 10–15 year floor finish that needs three replacements (B4) over 60 years against a 60-year masonry or tile finish. |
| End-of-Life Stage | C1 Deconstruction/demolition; C2 Waste transport; C3 Waste processing; C4 Disposal |
Mechanical tear-out (C1), hauling (C2), crushing/sorting (C3), landfilling, incineration, or biogenic carbon release (C4). |
Bio-based or wood finishes where biogenic carbon storage in A1 is partly released or landfilled in C3–C4, or composites bonded with adhesives that prevent recycling. |
Why Modules A4–A5 (Ancillary Installation Materials) Shift Finish Comparisons
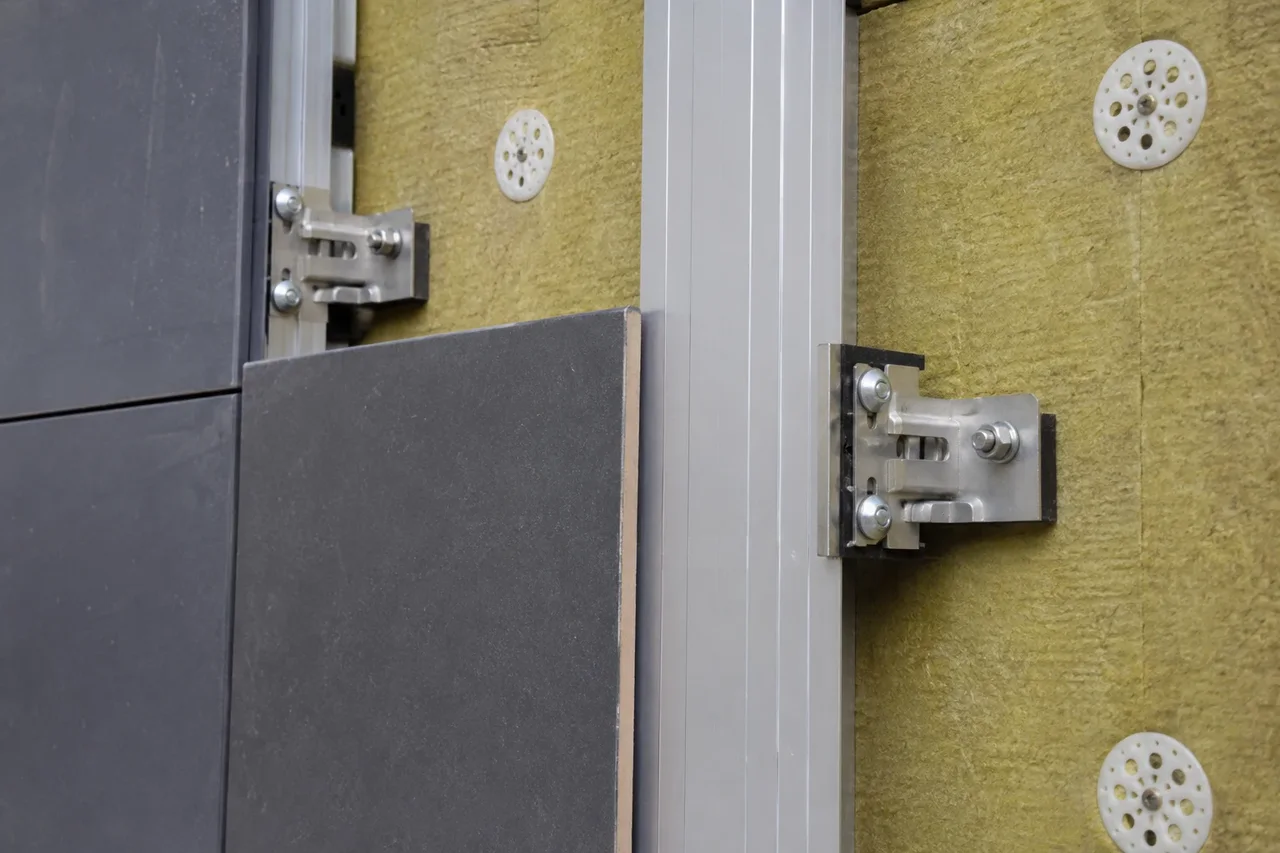
The U.S. EPA’s EPD Basics (2024) explicitly points out that Construction Stage modules (A4–A5) include ancillary materials required for installation as well as packaging and excess site waste. In wall and floor finishes, the surface layer is often only half of the installed material mass:
- A thin porcelain slab or gauged tile adhered to a wall or slab requires polymer-modified cementitious mortar, primer, backer board, and grout (
A5). - A floating floor plank requires a polyethylene vapor barrier and foam underlayment (
A5); see our vinyl flooring vs. tile comparison and flooring installation materials checklist for how subfloor flatness and underlay layers change the installed package. - An exterior rainscreen clad in fiber-cement cladding or metal wall panels requires extruded aluminum or galvanized steel vertical carrier rails, stainless-steel undercut clips, fasteners, and cavity brackets (
A5).
Why Modules B1–B7 (Reference Service Life and Replacement Cycles) Matter
In a cradle-to-grave (A1–C4) assessment or a whole-building LCA (WBLCA), module B4 (replacement) scales directly with the ratio between the building’s study period and the finish material’s Reference Service Life (RSL). If an interior commercial corridor is modeled over a 60-year building life, a finish with a 15-year service life under that traffic level requires initial installation plus three full replacement cycles—multiplying its A1–A5 and C1–C4 impacts by four.
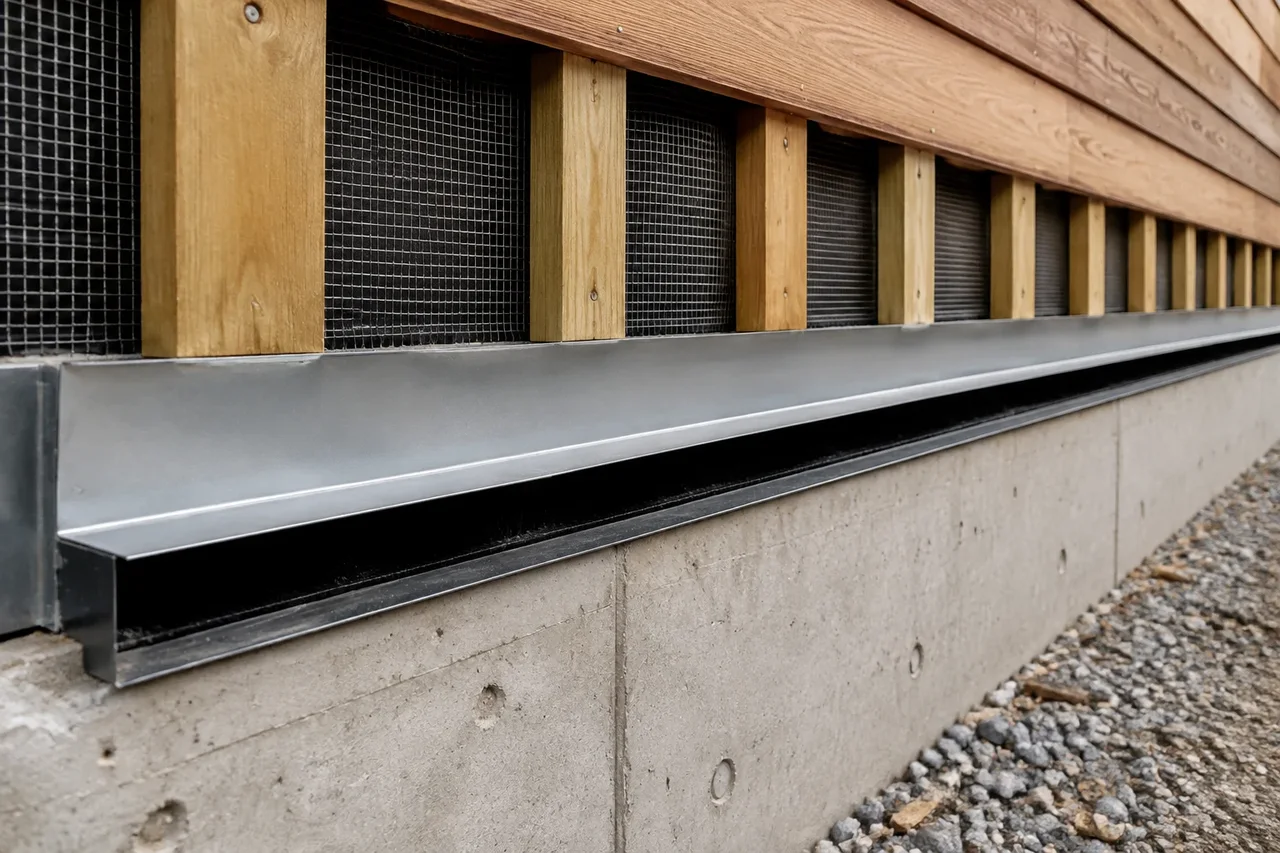
Conversely, durability in module B depends on installation detailing and exposure conditions—such as drainage ventilation behind exterior siding or moisture control beneath a floor—rather than the factory datasheet alone.
4. Step 3: Verify PCR Version, Data Specificity, and Temporal Validity
Even when two declarations both report 1 m² across A1–A3, three methodological variables inside the LCA can still prevent a valid comparison:
- Product Category Rule (PCR) alignment and ISO 21930 core rules: According to the U.S. EPA’s EPD Basics (2024), ISO 21930 serves as the core PCR for construction products and services. Where a stand-alone category PCR exists (for example, specific North American PCRs for resilient flooring, ceramic tile, or architectural metal panels), the EPD must follow that category PCR. If one declaration was prepared under an older PCR revision or used ISO 21930 alone without a category PCR (which some institutional procurement programs prohibit), allocation rules for co-products, recycled content, and biogenic carbon can differ.
- Foreground vs. background data and plant specificity:
Every LCA combines foreground data—manufacturer-specific primary data collected from plant operations, typically over a 12-month period—with background data from secondary life-cycle inventory databases covering regional power grids, fuel supply chains, and commodity feedstocks (U.S. EPA, 2024). Declarations fall into three specificity tiers:
- Industry-average EPD: Aggregates multiple manufacturers across a trade association to represent a sector benchmark.
- Manufacturer-average EPD: Averages production across multiple plants owned by a single manufacturer.
- Facility-specific (plant-specific) product EPD: Reflects a specific product line manufactured at a named plant using that facility’s actual energy mix and kiln or extrusion fuel. Comparing a single facility running on hydroelectricity against a multi-manufacturer national grid average compares grid geography rather than material formulation.
- Temporal validity (the 5-year rule): Once verified and registered by a program operator, an EPD is typically valid for five years (U.S. EPA, 2024), and must be updated earlier if significant changes occur in the manufacturing process or product formulation. Always check both the issue date and the expiration date on the cover page.
5. Why Carbon (GWP) Is Not the Whole Environmental Impact Picture
Many public and private procurement policies focus on embodied carbon, measured as Global Warming Potential (GWP) and reported in kilograms of carbon dioxide equivalent (kg CO₂e) over a 100-year time horizon (per U.S. EPA Understanding Global Warming Potentials and ISO 21930:2017 Section 7.3 Table 5). However, as the U.S. EPA’s EPD Basics (2024) emphasizes, GWP is only one of several impact categories quantified in an LCA and reported in an EPD.
Reducing a material comparison to kg CO₂e alone can mask severe trade-offs across other environmental compartments and occupant health boundaries:
Scroll horizontally to view all columns.
| Environmental or health dimension | How it appears in an EPD (or separate test document) | Typical trade-off to watch when comparing finish materials |
|---|---|---|
Global Warming Potential (GWP 100) |
Reported in kg CO₂e per declared or functional unit (ISO 21930:2017 Section 7.3 Table 5). |
High-temperature kiln firing (ceramic/porcelain) or primary metal smelting vs. petrochemical resin production or cement calcination. |
Acidification Potential (AP) |
Reported in kg SO₂e (sulfur dioxide equivalent) from SOₓ, NOₓ, and ammonia emissions to air, soil, and water. |
Fuel combustion in mineral processing, glass melting, or long-distance marine/truck transport. |
Eutrophication Potential (EP) |
Reported in kg Ne or kg PO₄³⁻e measuring nutrient enrichment of water bodies and ecosystems. |
Agricultural or forestry fertilizer runoff in bio-based feedstocks and wastewater discharges from chemical processing. |
Ozone Depletion Potential (ODP) |
Reported in kg CFC-11e measuring stratospheric ozone breakdown. |
Specific halogenated blowing agents in certain foam insulations or specialized chemical precursors. |
Photochemical Smog Formation (POCP / SFP) |
Reported in kg O₃e (ground-level ozone equivalent) from volatile organic compounds and NOₓ. |
Solvent-borne coatings, resin curing, and diesel transport emissions. |
| Resource Consumption (Energy & Water) | Primary energy demand (renewable vs. non-renewable, MJ) and net freshwater consumption (m³ or liters). |
Wet stone quarrying/polishing, slurry fiber-cement forming, or bio-crop irrigation vs. dry roll-forming. |
| Indoor Air Quality & Chemical Hazards (Not in standard EPDs) | Not measured by an ISO 14025 EPD. Requires separate third-party VOC chamber testing (e.g., CDPH Standard Method v1.2) and material ingredient disclosures. | An interior finish or adhesive can report low A1–A3 GWP while emitting formaldehyde or volatile organic compounds into occupied rooms if not verified separately. |
Key Takeaway: Treat GWP as one column in a multi-attribute review. Always inspect acidification, eutrophication, smog, water use, and primary energy alongside carbon, and verify indoor VOC emissions through dedicated indoor air quality test certificates rather than an EPD.
6. What to Request from a Supplier When Two Declarations Are Not Comparable
When you fill out the pre-comparison EPD boundary check sheet (CSV version) and find that two candidate wall or floor finishes have mismatched units, different PCRs, or missing modules, do not guess or invent conversion factors. Use the decision table below to request the exact supporting record needed to resolve the gap:
Scroll horizontally to view all columns.
| Boundary gap discovered during review | Why you cannot compare the numbers as printed | Exact documentation to request from the manufacturer or supplier |
|---|---|---|
| Summary brochure shows a single “% lower carbon” claim with no PCR or module table | Marketing summaries frequently omit the reference baseline, PCR version, and whether A4–C4 modules were excluded. |
Request the complete, registered Type III EPD PDF showing the program operator, registration number, PCR citation, and module table (A1–C4). |
| Product A declares per 1 kg while Product B declares per 1 m² | Mass and area cannot be compared without the exact installed weight per square meter of finished surface. | Request the technical datasheet stating nominal thickness, bulk density, and installed mass per square meter (kg/m²) for the exact profile specified. |
| Only an industry-average EPD is provided | Sector-wide averages blend high-emitting and low-emitting plants across multiple companies and power grids. | Ask whether a product-specific, facility-specific EPD exists for the manufacturing plant that will supply your project’s delivery region. |
| Two finishes belong to different categories (e.g., porcelain slab vs. WPC panel vs. metal cladding) | Different categories follow different PCRs and require different substrates, adhesives, or sub-frames (A4–A5) and replacement schedules (B4). |
Request the complete installation assembly bill of materials (adhesive/mortar coverage rate in kg/m² or carrier rail weight per m²) and model the full assembly in a whole-building LCA (WBLCA) tool. |
Wood or bio-based finish claims net-zero or negative A1–A3 carbon |
Biogenic carbon uptake during plant growth (A1) is governed by strict ISO 21930 accounting rules that require tracking carbon release or landfill storage at end of life (C3–C4). |
Request the full A1–C4 module breakdown separating fossil GWP from biogenic carbon flows and verify sustainable forestry chain-of-custody documentation required by ISO 21930. |
| Interior wall or floor finish is being evaluated for occupant health | Standard ISO 14025 / ISO 21930 EPDs quantify external life-cycle impacts, not indoor air concentrations inside an occupied room. | Request a third-party indoor VOC emissions test certificate (for both the finish panel and its required adhesive or sealer) and a material ingredient disclosure. |
For side-by-side functional and installation trade-offs across common finish families before you pull environmental declarations, review our material comparisons hub and our parent guide on how to choose building materials.
Method and Sources
This guide and the accompanying pre-comparison EPD boundary check sheet were compiled by the editorial desk to give specifiers, builders, and property owners a repeatable verification workflow before comparing environmental claims across wall and floor finishes.
- Standards and regulatory framework: Definitions of Environmental Product Declarations (
EPD), Life Cycle Assessment (LCA), Product Category Rules (PCR), functional vs. declared units, cradle-to-gate (A1–A3) vs. cradle-to-grave (A1–C4) boundaries, 12-month foreground data collection, 5-year validity windows, and multi-impact indicators (GWP, acidification, eutrophication, ozone depletion, smog formation, energy, and water use) follow the U.S. Environmental Protection Agency’s EPD Basics: Why and How to Develop an Environmental Product Declaration (EPA 744-F-24-002, November 2024), ISO 14025, and ISO 21930:2017. - Historical cross-category methodology: Explanations of why
A1–A3product declarations cannot be compared across categories without whole-building life-cycle assessment (WBLCA) and how declared units vary by material category (m²,kg,m³,m²-Rsi) reference the Carbon Leadership Forum’s 2021 Material Baseline Report (Version 2, July 2021) strictly as a historical methodology source, not as a current numeric benchmark. - Editorial independence and scope limits: This page intentionally publishes zero brand rankings and zero generic carbon lookup tables because product-specific EPD values depend on the individual manufacturing facility, local electricity grid, PCR version, and assembly boundary. Always verify the current registered EPD for the exact product and plant supplying your project.
Sources
- EPD Basics: Why and How to Develop an Environmental Product Declaration (EPA 744-F-24-002) — U.S. Environmental Protection Agency Accessed October 17, 2026.
- Understanding Global Warming Potentials — U.S. Environmental Protection Agency Accessed October 17, 2026.
- Manufacturer Information on Greener Products — U.S. Environmental Protection Agency Accessed October 17, 2026.
- 2021 Material Baseline Report (Version 2, July 2021 — historical methodology reference) — Carbon Leadership Forum, University of Washington Accessed October 17, 2026.